
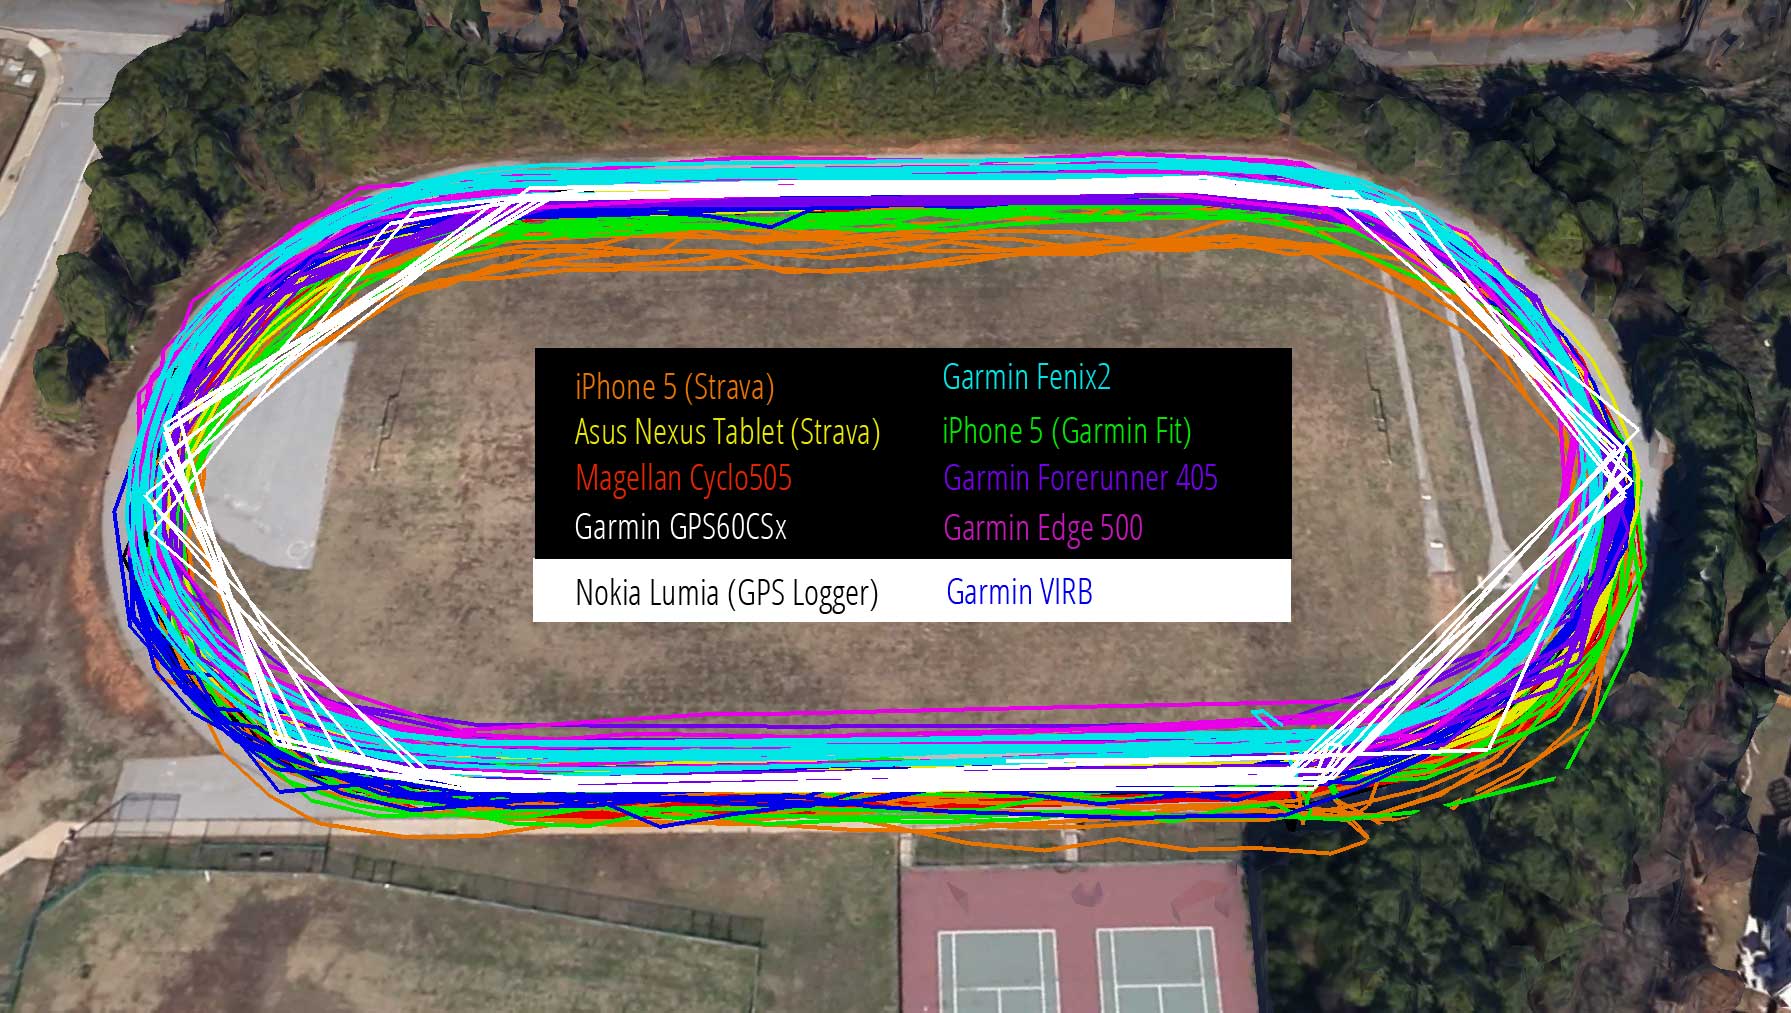
We tested 10 GPS devices and smartphone apps to determine whether some devices were more or less accurate than others. In our first report we looked at the distance each device recorded over a 2.5-mile test ride. Today I’ll dissect the elevation data recorded during the same test.
Here’s the raw data:
| Device | Elevation Max | Elevation Min | Elevation Range |
| Asus Android Tablet (Strava) | 1014.44 | 1013.78 | 0.66 |
| iPhone 5 (Strava) | 1015.09 | 1013.78 | 1.31 |
| Garmin Edge 500 | 1077.4 | 1070.9 | 6.5 |
| Magellan Cyclo505 | 1016.2 | 1006.8 | 9.4 |
| Garmin GPSMap 60CSx | 1072.8 | 1047.6 | 25.2 |
| Garmin VIRB Elite | 1043.6 | 1012.1 | 31.5 |
| Garmin Forerunner 405CX | 1044.9 | 1012.8 | 32.1 |
| iPhone 5 (Garmin Fit) | 1039.4 | 998.7 | 40.7 |
| Nokia Lumia (GPS Logger) | 1042 | 1000 | 42 |
| Garmin Fenix2* | 1080.7 | 976.4 | 104.3 |
Since our test was performed on a flat track, the elevation range should be as close to zero as possible. Our best estimate using various online tools is that the track actually has 1 foot of elevation change between its high and low points, and ranges from 1014 to 1015 feet above sea level.
* Note: The Fenix2 experienced a couple elevation “spikes” during the test, including recording one point at an elevation above 1200ft. We removed that point since it occurred at the start of the test, thinking it may have been a reading left over from a previous ride. However, the 1200ft point was actualy the second point recorded (not the first) which seems strange. Either way, the Fenix2 did the worst job collecting raw elevation data during our test.
Hardware
Many high-end GPS units feature a barometric altimeter in an effort to improve elevation accuracy, but truthfully it doesn’t make much difference. As one GPS company rep confirmed, a barometric altimeter is pretty useless unless it’s regularly calibrated. That’s because it uses atmospheric pressure to determine your altitude–but atmospheric pressure changes not just with elevation, but also with the weather. Only one of the top 4 units listed above features a barometric altimeter. The worst-performing unit includes a barometric altimeter as well. And FYI, our test happened a few hours after a massive storm system rolled through.
Services
When it comes to calculating elevation gain and loss over a ride, online services are important tools for improving accuracy. Two of the units in our test–the Garmin Edge 500 and Magellan Cyclo505–produced fairly-accurate raw elevation data, but the data still wasn’t nearly as accurate as the “calculated” elevation gain and loss generated by Strava.
Garmin Connect also attempts to calculate elevation data for rides uploaded to the service, but surprisingly they use a different model (most likely USGS or NASA) that is outdated compared to the one Strava uses. How do we know? Here’s one of the elevation profiles generated by Garmin Connect during our test:

Clearly this is wrong–we were riding around a flat track which obviously didn’t have 30+ feet of climbing per lap. So what gives? My theory is the elevation model being used by Garmin Connect was created by the USGS or NASA before the track was built. This model still shows a hill in the area that was flattened and developed for the track. Will this matter for most, if not all, mountain bike trails? Nope. But it’s still an interesting discovery!
Gross Elevation Gain and Loss

Calculating gross elevation gain and loss from a ride is tricky business because elevation data–whether collected directly via the GPS or calculated using software–often bounces around from point to point and rarely follows a regular, smooth line. So it’s not uncommon for two mountain bikers riding the same loop to wind up with total climb numbers that are hundreds of feet apart.
The plot above was taken from the Magellan Cyclo505, and aside from the first warm-up phase, it actually did pretty well, staying within a range of about 7 feet over 2.5 miles. Still, you can see all the micro-adjustments it’s making, and adding each of these tiny rises and falls can give a false sense of the actual elevation gain/loss during a ride. I ran this data through our own GPSApp.net tool, which calculated about 24 feet of gain/loss over the ride by smoothing the profile out a bit, which isn’t too far off from the estimated gain/loss (1 foot per lap X 10 laps = 10 feet).

Conclusion
So what did we learn from this test? Well, the good news is that dedicated, cycling-specific GPS devices like the Garmin Edge 500 and Magellan Cyclo505 perform better than smaller, less powerful devices when it comes to collecting raw elevation data. Still, that data is far from perfect, and I recommend using online software to validate and smooth elevation data collected using any device.
Your Turn: What GPS myths would you like us to test?


10 Comments
Dec 17, 2016
Nov 6, 2014
Nov 5, 2014
Nov 5, 2014
Nov 5, 2014
For the next test we'll definitely try to standardize to see how much difference that makes (though I don't think the smartphone apps we tested allow you to change the polling frequency). Another interesting test might be to use the same unit multiple times, each time trying a different polling method.
Nov 5, 2014
You will have to be sure to turn off the "smart" recording feature and record once a second to get some interesting results.
Nov 5, 2014
Nov 5, 2014
We plan on doing a second round of track tests to include a wheel sensor and a GPS device featuring GLONASS support. Our original test was to set up determine whether smartphone apps were as accurate as the GPS devices most people use. The next test will expand that to include newer GPS devices and old school tech like wheel sensors.
Nov 6, 2014
Nov 6, 2014