

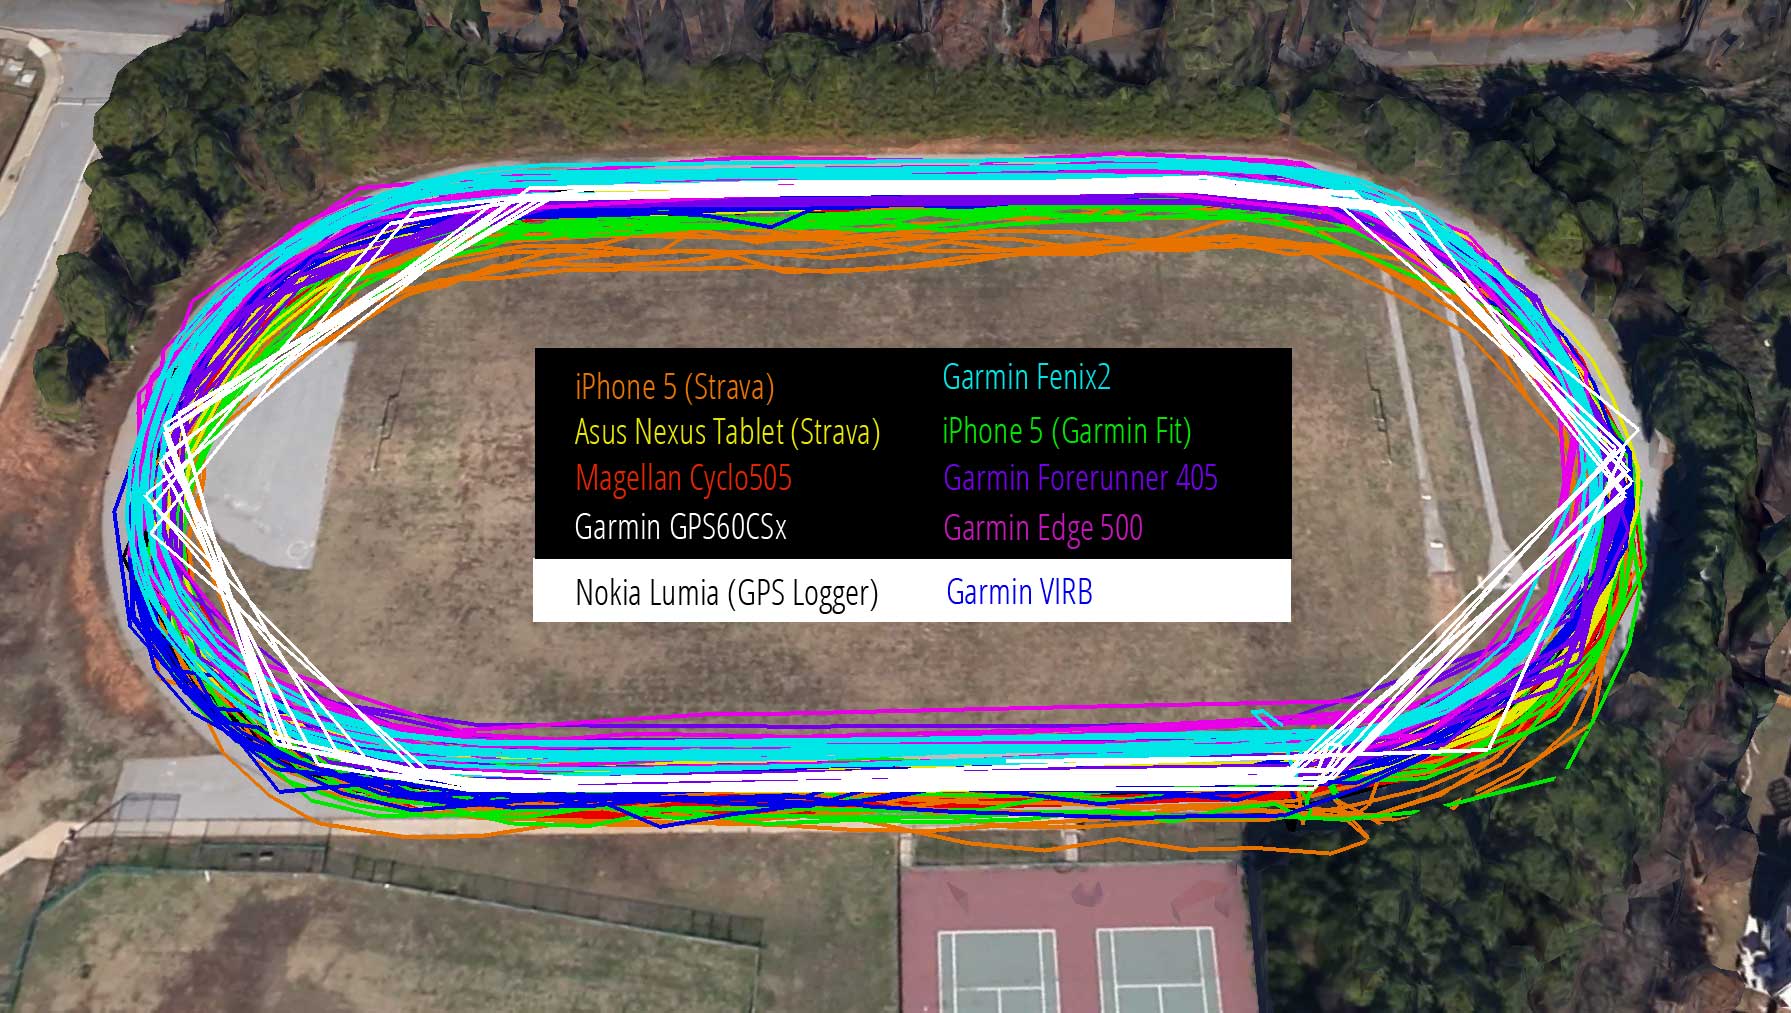
Two and a half years ago we conducted a test to see which was more accurate for recording distance and elevation data: a standalone GPS unit or a smartphone running a GPS app like Strava. In that test we found that GPS apps, running on a smartphone or even a tablet device, can record very accurate data. In fact, the Strava app on an iPhone and an Asus tablet reported more accurate data than any of the standalone GPS devices we tested.
We also found that most GPS devices overreport distances, though usually by less than 3%. Elevation data collection, on the other hand, is much more variable, and the use of online services like Garmin Connect and Strava can have a big influence on the accuracy of that data.
After reading through all the comments on our previous test, we knew we needed to perform a follow-up test, and since it’s been more than two years since the first test, we would need to bring in a new crop of GPS devices. This time around, we added a wheel-based cyclocomputer for comparison, and performed multiple rounds of testing to get a sense of both accuracy and consistency among the devices.
Set Up and Calibration
We used the same running track as in our 2014 test to ensure a course of known distance in a controlled environment. There was some question last time as to whether our track was a metric, 400m track or a quarter-mile track. Well, after this second round of testing, we can confirm the track is indeed a quarter-mile track, as more than one device measured 4 laps at exactly 1 mile.

The wheel-based cyclocomputer we used for this test is a simple Cateye Velo 7. Like most cyclocomputers on the market, the Cateye Velo 7 measures the frequency and number of revolutions the bike wheel makes to determine speed and distance. In fact, official running events require the use of a similar, wheel-based device for certifying course distances, because this method is generally known to be quite accurate. However, it’s crucial that the correct wheel circumference is programmed into the cyclocomputer to achieve a high level of accuracy.
While we did our best to calibrate the Cateye Velo 7, we were unable to get definitive accuracy based on our wheel setting. The included documentation suggests a circumference value based on wheel diameter and tire size, which in the case of our test bike, was 233cm. We double-checked this value by running a piece of tape along the circumference of the tire, then measuring the tape, which gave us a value of 233.3cm–not too far off! (The Cateye Velo only accepts whole numbers, so we used 233cm.) The result: the Cateye Velo 7 reported our 1-mile test circuit was 1.02 miles long, or 2% longer than the actual length.
Now, keep in mind that mountain bike tires aren’t perfect circles due to tire deflection. So, it’s possible our actual riding tire circumference was less than 233cm. According to my calculations, the cyclocomputer clocked 706 revolutions during the test. So, to get exactly 1 mile from our test, we should have set the wheel circumference to 228cm, which seems like a big difference from 233cm–more than the amount I would expect the tire to deflect.
The alternative explanation is that the track is actually 2% longer than a quarter mile, or that I didn’t stay completely true to my line around the track. The latter sounds more plausible, but the other two explanations could also be at play here as well. However, averaging all the device readings across all the rounds of testing shows an overall average reading of 1.003 miles, which makes a strong case for saying the true length of the test route is indeed 1.0 miles.
This time around we ran three, one-mile tests instead of a single, 10 lap, 2.5-mile test. Each test took place with a short rest in between to stop and restart all the devices. The test took place at around 4pm local time with partly to mostly cloudy skies.
Distance Accuracy
I was actually pretty shocked to see how well each device did in our test.
| Device | Test 1 | Test 2 | Test 3 | Average error |
| iPhone 6s Plus, Endomondo | 1.00 | 0.99 | 0.99 | -0.67% |
| iPhone 6s, Strava | 1.01 | 1.00 | 1.01 | 0.67% |
| Garmin Edge 520 | 1.01 | 1.01 | 1.01 | 1.00% |
| Lezyne Mini GPS* | 1.02 | 1.02 | 1.02 | 2.00% |
| Bryton Rider 330 | 0.97 | 0.97 | 0.97 | -3.00% |
| Trywin D1 | – | – | 1.003 | – |
All the devices we tested were within 3% of our one-mile benchmark, and all but the iPhone apps were completely consistent from test to test. That second part blows my mind. Of course we need to do more testing, but this suggests that two riders, with the exact same device riding the same course at the same time, should get nearly identical results. In reality, this hasn’t been my observation, but again, I’d be really interested to test this.
The Trywin GPS listed in the results is an inexpensive GPS we picked up online and reviewed several months ago. Unfortunately the button combos and menus are so complicated I failed to correctly start and/or stop the device during our first two tests. It’s a shame, too, because in the third test when the GPS actually worked, the Trywin turned out to be the most accurate, off by just 0.3%.

Officially, the iPhone 6s running Strava and the iPhone 6s Plus running Endomondo were the most accurate in our test (±0.67%), followed closely by the Garmin Edge 520 (+1%). The Garmin Edge 520 does deserve props, however, because it was more consistent than the iPhones. Also, it should be noted that the Strava app itself only reports distances to the nearest 0.1 miles, so we had to run the iPhone 6s data through an online tool to get more precision, meaning that result is not 100% verified.
The least accurate device in our test was the Bryton Rider 330, which consistently underreported our control distance by 3%.
Elevation Accuracy

Measuring elevation is notoriously tricky for any device, whether the device is using GPS signals, a barometric altimeter, or both. Our cyclocomputer, the Cateye Velo 7, doesn’t measure elevation data, so it’s not included in the test results. And while the Trywin GPS does measure elevation data, we don’t have a way to get the raw data off the device to analyze it, making it impossible to compare to the other devices. (Again, this is a shame because the on-device summary for the single test we were able to complete with the Trywin shows zero elevation gain or loss, which is pretty much spot-on correct.)
| Device | Average Elevation | Average Elevation Change |
| iPhone 6s, Strava | 1014.4 | 1.20 |
| Garmin Edge 520 | 1021.3 | 2.40 |
| iPhone 6s Plus, Endomondo | 1013.5 | 12.33 |
| Bryton Rider 330 | 733.7 | 7.23 |
| Lezyne Mini GPS* | 1017.5 | 29.70 |
Using data and research from our previous test on this track, the correct elevation for the track should be between 1,014 and 1,015 feet above sea level. For the devices we tested this time around, the Strava and Endomondo apps on iPhone reported the closest average elevation to actual (1014.4 and 1013.5, respectively) while the Bryton Rider 330 reported the least accurate elevation, averaging 733.7 feet across the three rounds of testing.
While knowing the actual elevation above sea level during a ride is interesting, most mountain bikers are more interested in knowing how much elevation change was experienced during the ride. For this measure, we would expect elevation variation (that is, the difference between the minimum and maximum elevations) during the tests to be essentially zero since the track is flat, though to account for a slight variation in elevation around the track, we’ll say that 1 foot of elevation variation is just as accurate. The chart above shows the elevation profiles generated by each app and device.
On this measure, the Strava App on iPhone 6s is the most accurate, averaging just 1.2 feet between the minimum and maximum elevations reported. The Garmin Edge 520 comes in close behind, adding just another foot or so to the variation. The Lezyne Mini GPS had a real problem here, showing wild elevation variations of up to 53 feet in a single test. The Endomondo app had problems as well, showing an average of 12 feet of variation per test.
It should be noted that neither the Strava or Garmin data was taken directly from the device, allowing those respective online services to potentially correct the data in the cloud. However, the same can be said of the Endomondo data, which ended up with the second worst performance in our test.
Takeaways
Compared to our first test, it seems GPS devices and apps are becoming even more accurate than they were even just a couple years ago. Of course this could be due to the mix of devices we used in the two tests or even the weather, but it does seem plausible that GPS hardware and software are continuing to improve.
Smartphone apps still dominate in terms of accuracy, and inexpensive GPS units appear to report the least accurate data. Even the stalwart of cycling distance measurement, the cyclocomputer, clearly has its flaws and can’t be considered much more or less accurate than GPS and smartphone devices**.
So, as always, take your ride data with a grain of salt and realize that it will never be 100% accurate, no matter which device you use.
* The Lezyne Mini GPS we tested is an older model, and is not the same device that is currently on the market.
** This does depend heavily on the layout of the course, which we will detail in a future article. But for the purposes of this simple test, the cyclocomputer isn’t much more or less accurate than the others.


13 Comments
Mar 10, 2017
Of course it really doesn't matter, either number is an estimate to some extent, as is the value taken directly from the head unit, or from any cycle computer. Not knowing the "true" value, I have simply decided to accept the value direct from the head unit as "the" distance. Since the only comparison that matters to me is among my numbers (i.e. what's my longest one day ride of the year?), I have my answers without any loss.
Jun 15, 2020
Not willing to bash the article by itself but it's important to warn other readers:The experiment only tests one scenario: Running circles in an athletic track, under specific environmental conditions. And even limiting it to that, it's flawed.
1. Your gold standard should have been the track, but you don't know if it's 400m or 1/4 mile.
2. Your 2nd best option is the number of revolutions, but the way you measured it it not right. Please check a document to certify athletic road races (USATF). It will show how to calibrate the bike (pages 9-17).
And, on the track, you need to ride at 30 cms from the kerb
Luckily, most GPS units can use an speed sensor as source distance (not the GPS). At least for the calibration.
3. I find the GPS units far more flexible, so you can have more constellations, WAIS, enable 1s recording.
4. As one reader mentioned, the traces for the GPS units are FAR more consistent than both iphone traces. It's impossible to conclude that the smartphone is more accurate when it has cancelling errors (one must use point to point mean square error to really assess the accuracy)
5. Yet, in MTB, it's completely unrealistic to rely on GPS (trees, rocks, bridges, buildings, electric lines) or speed sensor with the wheels jumping from rock to rock or sliding while breaking into a corner.
6. Strava segments are just a ridiculous competition: One may use an e-bike, other has a far lighter bike or better tyres, the next got lucky with a strong tailwind... or someone crafted a GPX file...
Even by pure luck, you can save couple of seconds at the start and at the end as the algorithm chooses the closest points to start and end, specially in short segments.
Jun 18, 2020
Errata: In my previous post, where it says "number of revolutions" should have said "number of wheel revolutions".
Where it says "WAIS" should be "WAAS"
Where it says "point to point mean square error" would be better understood if it says "point by point mean squared error" so the error of each GPS point is averaged, and not the error in distance between two inaccurate GPS locations.
Jan 27, 2017
The bottom line point is that you probably could run the tests over and over exactly the same and come up with different results each time.
Jan 27, 2017
Jan 25, 2017
I totally agree that we shouldn't expect any of the GPS devices to be perfect. While absolute accuracy might not be all that valuable, hopefully these test results at least hint at relative accuracy among devices and device classes.
We addressed GLONASS and GPS constellation support in our first test, so we didn't go into too much detail here. The short version is, while smartphones might not have GLONASS support (the Edge 520 in this test does include it), they're often able to use additional sensors like Wi-Fi and cell tower triangulation to improve accuracy over a single constellation system.
Feb 8, 2017
Jan 26, 2017
Jan 26, 2017
However, a lot of mountain bikers are attempting to use GPS for virtual racing (Strava) where accuracy counts, and even being off by 1% is a big deal. In fact, the reason we decided to do this test was because people were arguing about whose device was more accurate, and who was "cheating" by using an inferior device.
I wish I could dig up the conversation but someone literally suggested that Strava should flag KOMs that were earned using a smartphone vs. "more accurate devices" like Garmin GPS units. LOL.
So, my hope is these results convince virtual racers they should stop stressing over virtual race results, since there is no way to definitively say ANYONE'S results are 100% accurate.
Jan 26, 2017
Jan 26, 2017
I think you were missing the other mike's point about the test. Your distance isn't representative to what people are trying to do. If you're point is to show out what each device does to Strava KOM's then actually go test all the devices on your bike at the same time and do 10 different KOM's in your area and see which ones if any give you better results vs the official elevation and distance Strava has for the KOM. The Strava KOM is based off mapping data for its distance and elevation change so that seems like a decent, demonstrable control case for the different results.
Cool idea, but I'd have liked to see some better test cases essentially. Check out some of dcrainmaker.com GPS tests sometim.
Mar 14, 2017
So I wouldn't agree that smartphone apps dominate in terms of accuracy. Interpolated distance may be about correct just by accident, not because of more accurate raw data.
It even looks to me, that iPhone might not always match a previously created Strava segment on "random" route, if there's so much variation as it looks like.
Jan 25, 2017
More important to the buyer is what satellite constellation the device uses. Does it support only the US satellite system or also the European and Russian satellite systems. The more satellites and the better quality signal the better the accuracy.