
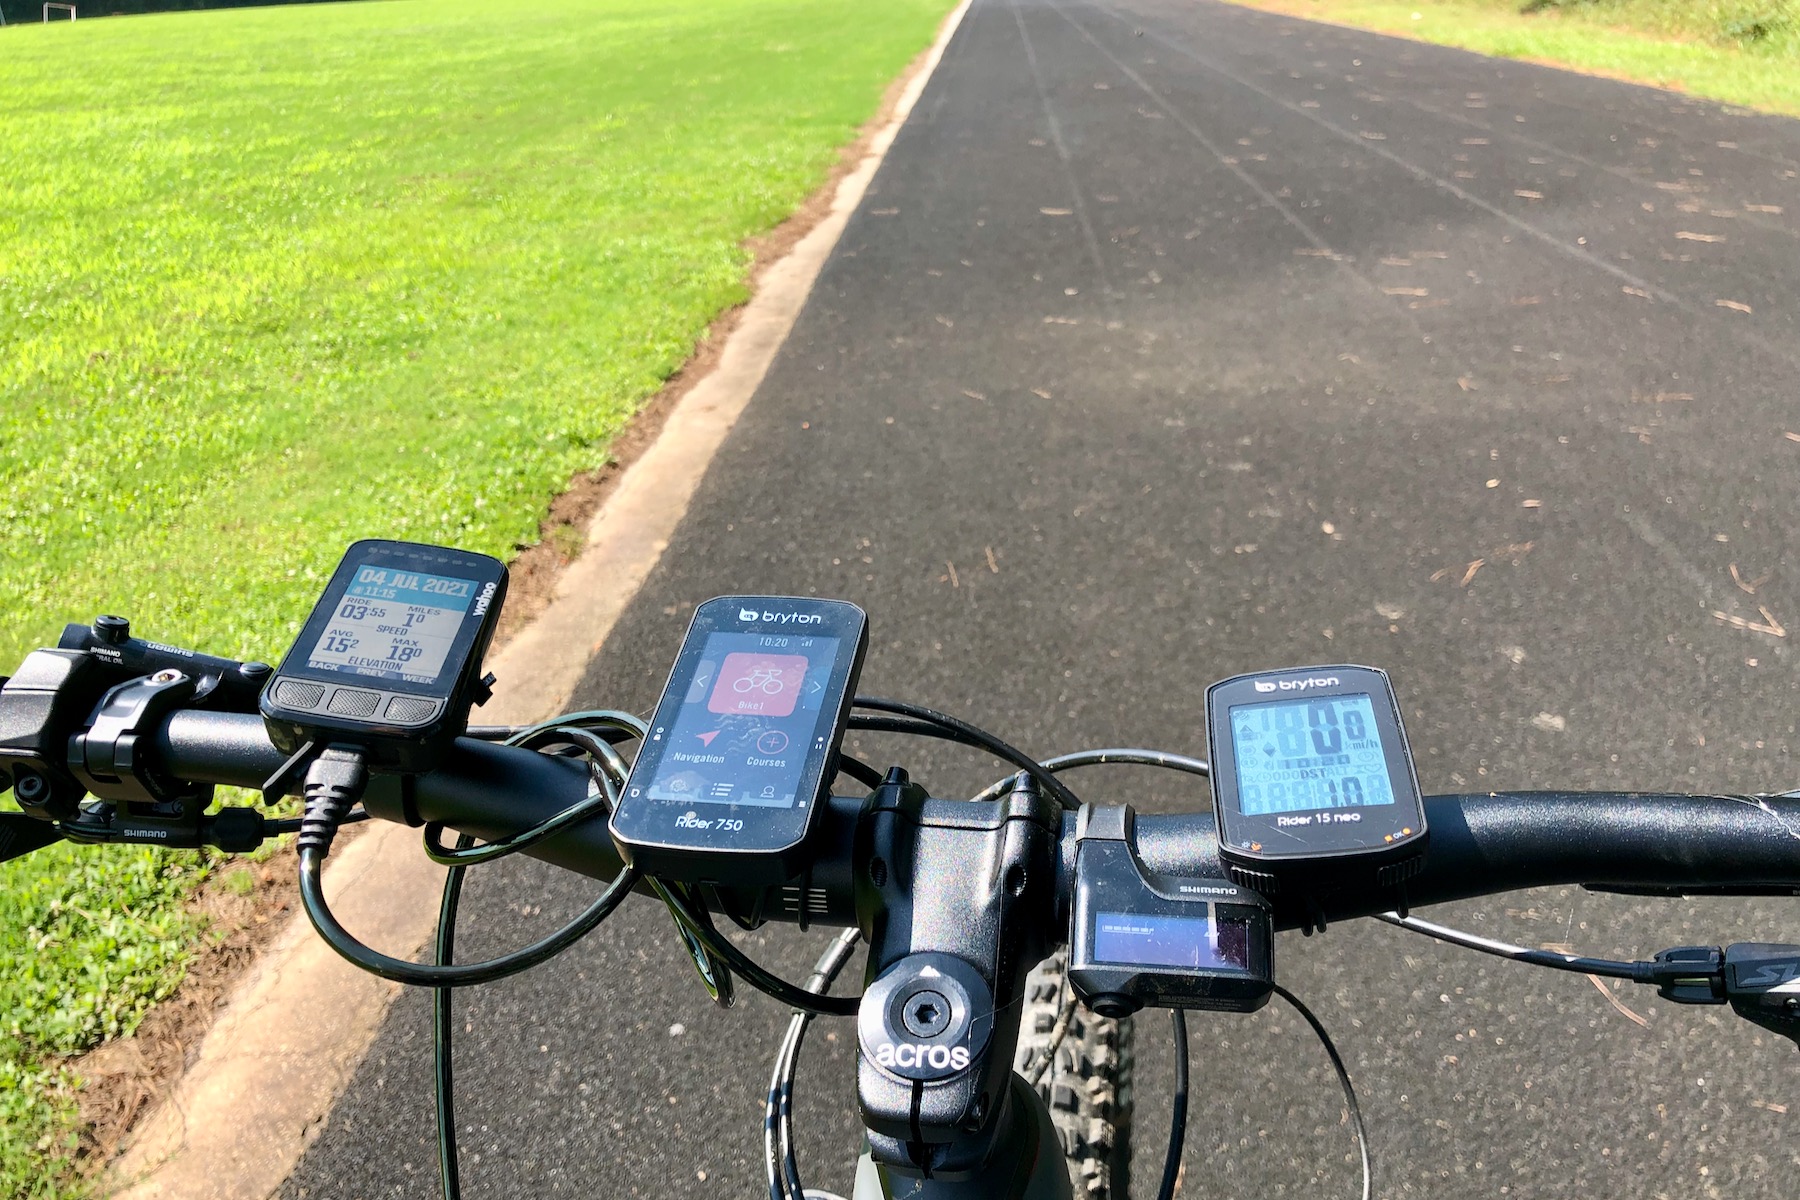
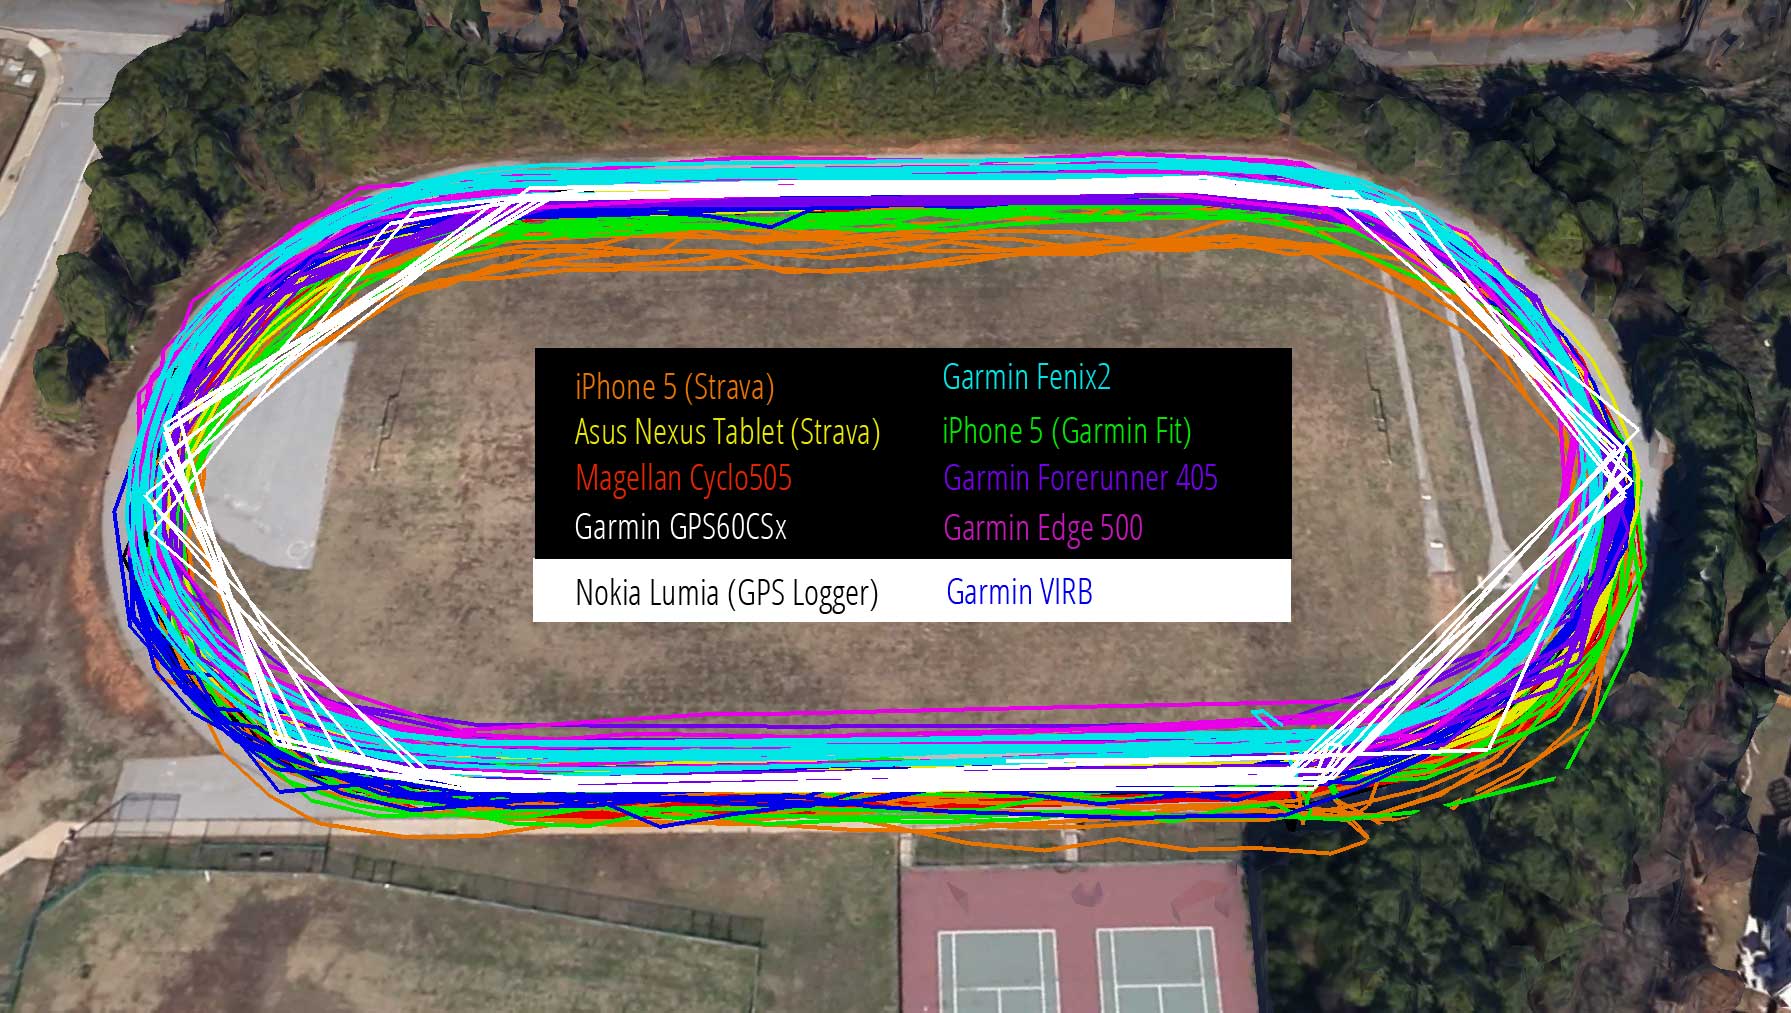
About seven years ago we conducted our first head-to-head, GPS accuracy test. It was a lot of fun, and we learned a lot not just from the test but also from reader comments. Understandably mountain bikers argue that an oval track test doesn’t simulate the real-world conditions experienced on the trail where tree cover, mountain shadows, and squiggly trail lines challenge even the most high tech devices. We hear you. And yet for Round 3, we’re back at the track.
An oval running track offers ideal GPS testing conditions: a known distance and elevation along with wide-open skies for optimal satellite connections. If a GPS device struggles here, there’s a very good chance it will struggle just as much or even more on a noisy, messy bike trail. By looking closely at the data from this test we get a very good idea about how accurately each unit will perform on the trail.
| Device | Error |
| Wahoo Elemnt Bolt v2 | -0.50% |
| Wheel-based | -1.00% |
| Garmin Forerunner 235 | 1.00% |
| Bryton Rider 750 | -2.00% |
| Strava app | 2.50% |
| Bryton Rider 15 neo | -3.50% |
The chart above shows how accurate each device’s distance was on our control route, which is four laps around a quarter-mile track. The test was conducted twice and the results are averaged. The wheel-based computer listed above is a Shimano STEPS e-bike system.
When we use the term ‘GPS accuracy,’ what we’re really talking about is how close the actual distance traveled and vertical elevation climbed are to what the GPS unit reports. This is influenced by a number of factors, which I’ll address individually below.
- How often points are collected.
- Warm up and auto start / stop.
- The pinpoint accuracy of each point plotted along the route.
- Elevation calibration and data post-processing
Polling frequency
Polling frequency is perhaps the single biggest factor when it comes to GPS accuracy for mountain biking. Each GPS unit has a set number of location checks that it makes every minute, and some devices allow the user to adjust this frequency. Most buyers will simply use the unit’s default settings. Less frequent polling has the advantage of reducing data storage requirements and may also help extend battery life. More frequent polling should improve accuracy, especially for tracking singletrack rides that are full of twists and turns.
| Device | # data points |
| Wahoo Elemnt Bolt v2 | 238 |
| Strava app | 233.5 |
| Bryton Rider 750 | 214.5 |
| Garmin Forerunner 235 | 85 |
| Bryton Rider 15 neo | 54.5 |
The chart above shows averages of the number of data points collected by each device during the tests. As a point of reference, the Wahoo Bolt and Strava app both seem to plot location about once a second. Note the wide range of points collected.

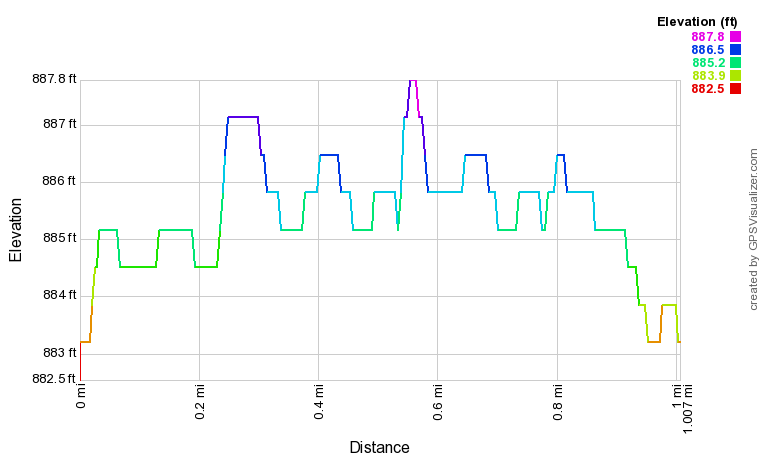
Bryton Rider 15 neo 
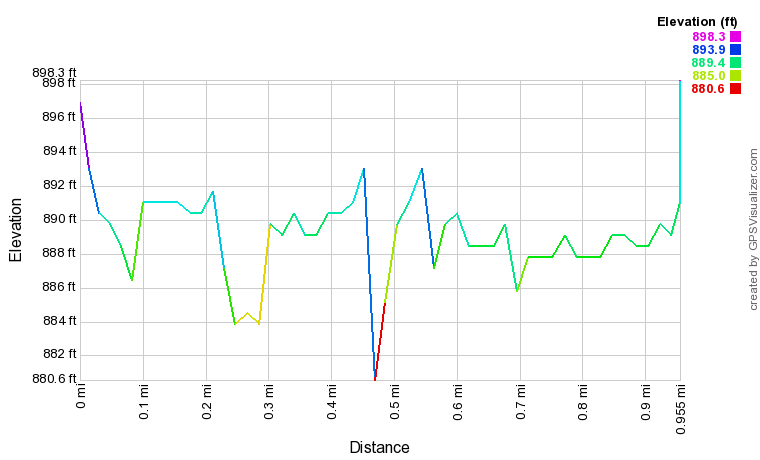
Bryton Rider 750


When a computer polls less frequently — say just once every four seconds like the Bryton Rider 15 neo — there’s a chance it’s missing the dips and turns in the trail. GPS devices calculate the distance traveled by simply measuring the distance between each plotted location during the ride using straight lines. In the left plot above the curve of the track isn’t accurately captured; it looks like the rider took shortcuts along the way. As a result, the distance tracked by that device is under-reported. If your GPS consistently shows lower mileage than your buddy’s after a mountain bike ride, chances are good that your device is not polling as frequently.
If you can crank up polling frequency on your app or device, that is an easy way to improve accuracy. If not, you may need to upgrade to a more expensive unit to get better accuracy. At the other extreme, polling too frequently could lead to over-reported distances as margins of error compound. Polling once a second seems to be the sweet spot. Oh, and if you’re riding especially fast, try slowing down to get more accurate distances.
Warm up
In the early days of GPS it could take agonizing minutes for a device to warm up and get a lock on enough satellites for tracking. Today’s GPS units tend to warm up much quicker, but it’s still necessary to find satellites before starting.

The plot above is from the Strava iPhone app and shows that the first point it recorded is off by a lot. In fact, this one point essentially tanked the app’s performance in our test; it’s likely it would have been near the top, rather than the bottom, in the distance test. As a device warms up, it’s trying to get a lock on signals from various sources — generally satellites, but smartphones also triangulate using cell towers and other wireless data sources. The more sources your GPS can lock onto, the more accurate your position. In a short, one-mile test like this one, just one errant data point from a fuzzy location lock makes a big difference. On a longer ride, a blip like this won’t be noticeable.
Auto pause
Many GPS devices include an auto-pause feature that starts and stops recording depending on your movement. Most allow you to disable this feature if you like, though it can be helpful. In this test, some of the devices were using auto-pause so they needed a second or two to automatically start recording once the bike was rolling. You can see this in the right image in the polling frequency plot above where the start and end points don’t quite match up.

Before you go turning this feature off to improve your GPS accuracy, note that auto-pause will actually improve accuracy in most cases, especially if you find yourself stopped for any amount of time during a ride, unlike in our test. If you’ve ever left a GPS unit running while enjoying a beer as I did in the plot above, you’re no doubt familiar with the GPS dance. Individual point readings each introduce their own margin of error which makes it appear to the GPS that you’re moving, even when you’re not. My advice: use auto-pause for more accurate distances. Auto-pause tends to under-report distances slightly, while not using it tends to over-report distances, sometimes by a lot.
Pinpoint accuracy
As I hinted in the auto-pause section, each time a device reports a location there is some margin of error built into that position. Myriad factors play into that error including the sensitivity of the device and signal strength due to cloud cover, tree cover, and mountain shadows, just to name a few. While we can’t control the weather and by extension, signal strength, some GPS units are more sensitive than others and therefore will tend to introduce fewer errors.
This is perhaps the most difficult to quantify; in general, more expensive devices will include more sensitive receivers and chip sets. Looking at the data from this test, most if not all of the error found can be explained by polling frequency and warm-up / auto-pause factors rather than signal strength, especially given the ideal testing conditions.
To get better accuracy, a more expensive device with better chips and support for multiple satellite links can help. In addition, simply ensuring the device is free from obstructions can also help. For example, moving a smartphone from a pocket to the bars could improve reception.
Elevation
| Device | El. change (ft.) |
| Strava app | +0/-1 |
| Wahoo Elemnt Bolt v2 | +1.5/-3 |
| Garmin Forerunner 235 | +26.5/-25.5 |
| Bryton Rider 750 | +37/-38 |
| Bryton Rider 15 neo | +35.5/-32.5 |
GPS units are generally very good at calculating distances, and slightly less good at calculating elevation. I like doing a track test because it’s about as flat of a surface as you can find, so the elevation plot should look like a pancake. But it never does. Take a look at these samples.

Garmin Forerunner 235 Wahoo Elemnt Bolt v2 Stava iPhone app Bryton Rider 15 neo


I’ve found the most accurate elevation data comes from services like Strava that correct the data in the cloud after the ride. Each data point is essentially collected in 3D with an x, y, and z coordinate. Post-processing takes the x and y coordinates and looks up the z using a massive database of known elevations around the globe, replacing the recorded z with the known z.
The Strava app showed the least elevation variation in this test round, and from what we can tell, the service post-processes ride data. Garmin may be post-processing the data, though in past tests we’ve surmised they are using an older, less up-to-date elevation database. Bryton does not seem to correct elevation data at all and instead relies on values collected on the device itself. Wahoo was second-most accurate, and looking at the plot it doesn’t appear they are actually post-processing the data, which if true would be impressive.
More expensive GPS units tout additional sensors that seek to improve elevation accuracy, and they do seem to help a bit. However, none are a match for elevation lookup after the ride so if you have a cheap GPS, just run the data through an online service to get the most accurate elevation data.
Takeaways
Looking at the first chart it’s tempting to conclude that some GPS devices are more accurate than others and are therefore better purchase options. However, some of the factors that affect accuracy are actually within the user’s control, making it possible to squeeze better performance out of any given device with the right settings.


11 Comments
Jul 15, 2021
Jul 15, 2021
I'm not great at statistics so I don't know if averaging 3 pings could effectively reduce the error. I think it's time to interview an engineer who designs these things!
Aug 13, 2025
Jul 16, 2021
Aug 13, 2025
Jul 20, 2021
So I got a cheap Garmin Edge 25 that can use the wheel sensor, and no more 22 mile rides that come in at 19 anymore!
Jul 20, 2021
Jul 22, 2021
Jul 14, 2021
Jul 14, 2021
Jul 14, 2021
Doh! Thanks for the suggestion. It may take me a while to do this, but I can measure against my Polar Vantage V2, Strava App and the Garmin 530. I will gladly share my results and send you the data to analyze. I'll reach out to you once I have the test done.
PS. I got busy, forgot about this and, unfortunately, gave my Polar equipment away. I've also moved up to the Garmin 1040.