We put together this infographic based on the survey we ran last month. and gained a ton of great insights! Feel free to draw your own conclusions; this information wasn’t compiled to push any particular agenda or a particular way of thinking about trails. However, I would like to offer some additional info on flow trails and volunteering that didn’t quite fit the objective data presented above.
Flow trails
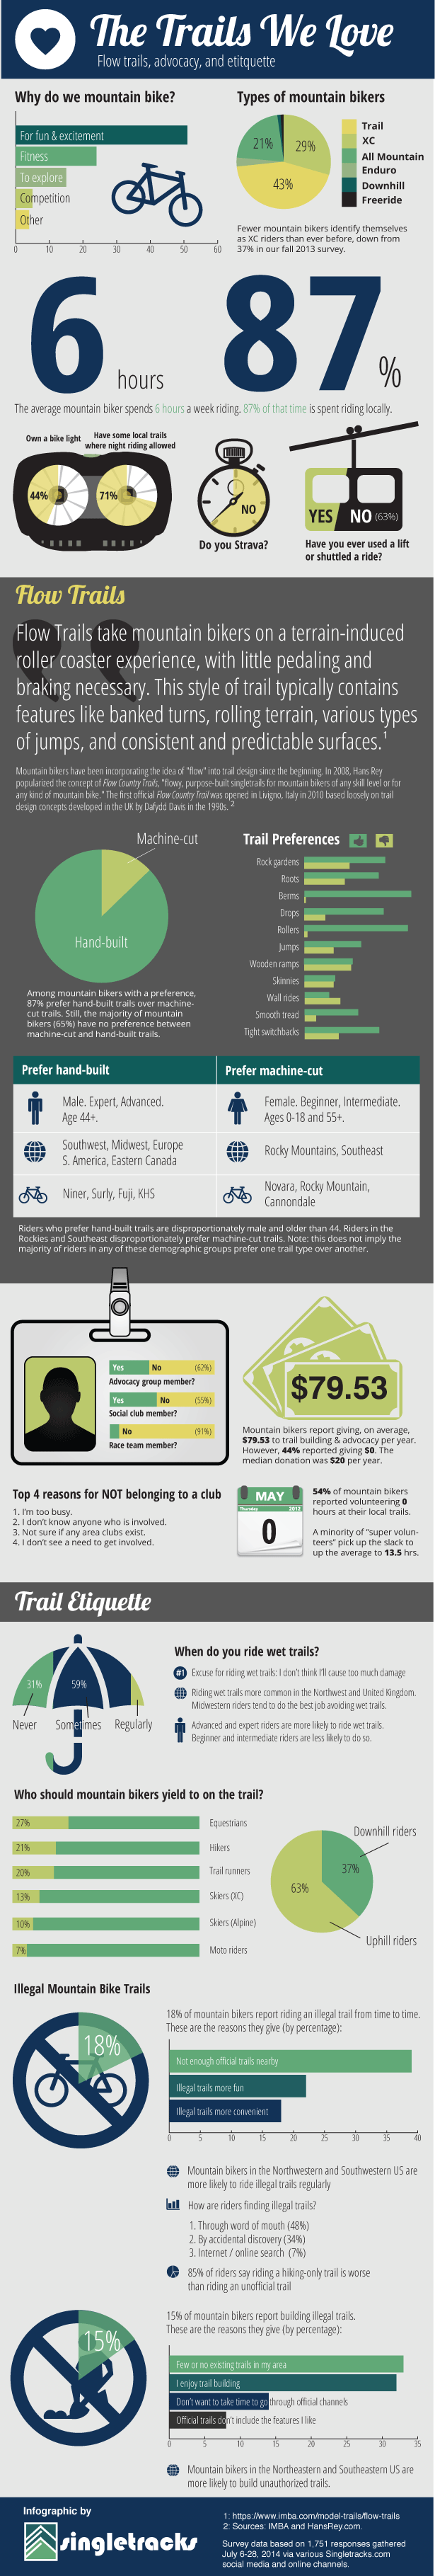
Most mountain bikers don’t have a preference for machine-cut or hand-built trails, which makes sense: with so many places to ride these days, it’s really up to the rider to pick the trails they enjoy. However, if a trail were being designed by popular vote, two features stand out as “must haves”: berms and rollers. These features were by far the most popular and also the least disliked features; not only that, they’re both hallmarks of the “flow trail.” So perhaps flow trails are the most politically correct, or at the very least, the type of trail that will be appealing to the widest audience (despite the fact that few seek these trails out explicitly.)
Volunteering
We were a little surprised (disappointed?) at how little most mountain bikers give in terms of time and money to trail development and maintenance. We decided to go beyond the raw data and get a sense of how the average mountain biker trades off between giving time and money to their local trails, and found these rules of thumb.
The #1 reason people aren’t involved in a local club is reportedly because they’re too busy. So, among those who volunteered zero hours but donated money to trail advocacy, the average donation was $42. Our suggestion: if you can’t give any time this year, consider giving at least $50 to your local club.
For younger riders or those on a budget, time may be more abundant than funds. Among riders who donated $0 but volunteered at least 1 hour, the average time spent working on trails was about 5 hours.
Finally, we found that those who volunteered time at their local trails are averaging about 1 hour of volunteer trail work for every 20 hours of riding. If we all do our share based on the amount of use we get out of our local trails, we can make a big difference!
What stands out to you in the infographic above?
Download the PDF version of the infographic, suitable for printing. Want more infographics? Take the 2014 MTB Gear survey to contribute to the next one!